Calculates height, location and width of peak at the reflectance midpoint (FWHM).
Note: bounds should be set wide enough to incorporate all minima in spectra. Smoothing
spectra using procspec() is also recommended.
Usage
peakshape(
  rspecdata,
  select = NULL,
  lim = NULL,
  plot = TRUE,
  ask = FALSE,
  absolute.min = FALSE,
  ...
)
Arguments
- rspecdata
(required) a data frame, possibly of class
rspec, which contains a column containing a wavelength range, named 'wl', and spectra data in remaining columns.- select
specification of which spectra to plot. Can be a numeric vector or factor (e.g.,
sex == "male")- lim
a vector specifying the wavelength range to analyze.
- plot
logical. Should plots indicating calculated parameters be returned? (Defaults to
TRUE).- ask
logical, specifies whether user input needed to plot multiple plots when number of spectra to analyze is greater than 1 (defaults to
FALSE).- absolute.min
logical. If
TRUE, full width at half maximum will be calculated using the absolute minimum reflectance of the spectrum, even if that value falls outside the range specified bylim. (defaults toFALSE)- ...
additional arguments to be passed to plot.
Value
a data frame containing column names (id); peak height (max value, B3), location (hue, H1) and full width at half maximum (FWHM), as well as half widths on left (HWHM.l) and right side of peak (HWHM.r). Incl.min column indicates whether user-defined bounds incorporate the actual minima of the spectra. Function will return a warning if not.
Author
Chad Eliason cme16@zips.uakron.edu
Rafael Maia rm72@zips.uakron.edu
Hugo Gruson hugo.gruson+R@normalesup.org
Examples
data(teal)
peakshape(teal, select = 3)
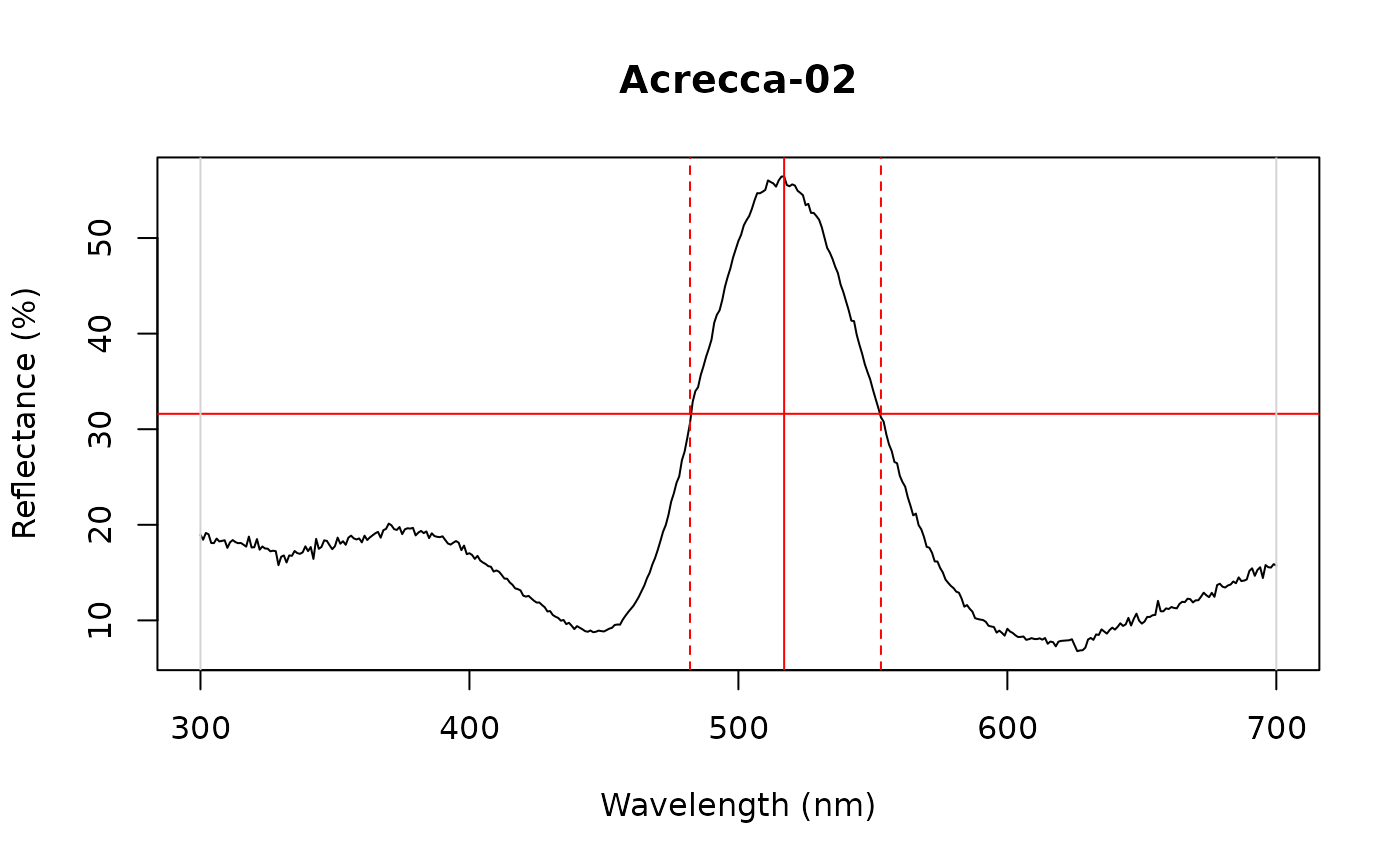 #> id B3 H1 FWHM HWHM.l HWHM.r incl.min
#> 1 Acrecca-02 56.4446 517 71 35 36 Yes
peakshape(teal, select = 10)
#> id B3 H1 FWHM HWHM.l HWHM.r incl.min
#> 1 Acrecca-02 56.4446 517 71 35 36 Yes
peakshape(teal, select = 10)
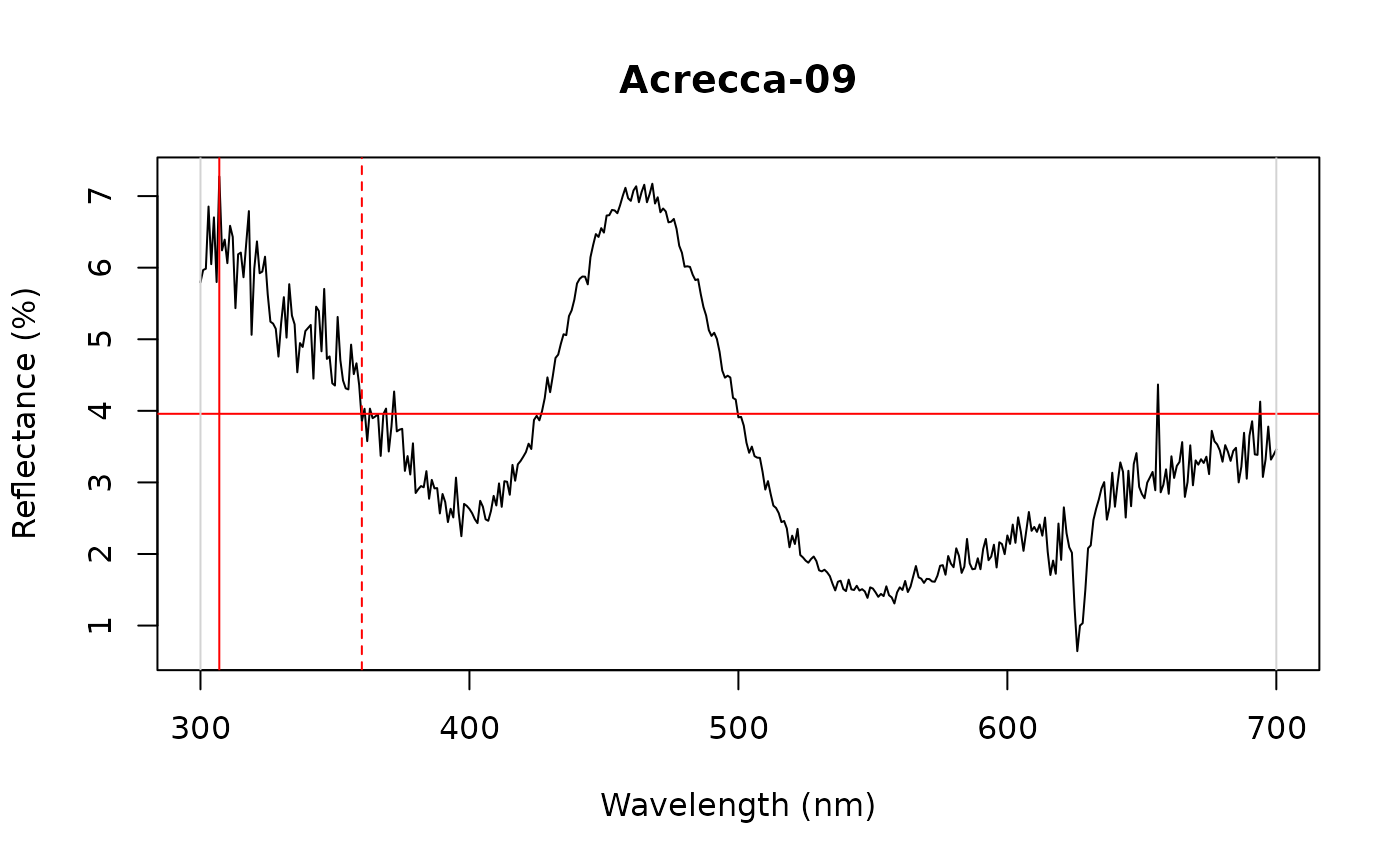 #> id B3 H1 FWHM HWHM.l HWHM.r incl.min
#> 1 Acrecca-09 7.2747 307 NA NA 53 Yes
# Use wavelength bounds to narrow in on peak of interest
peakshape(teal, select = 10, lim = c(400, 550))
#> Warning: Consider fixing “lim” in spectra with “incl.min” marked “No” to incorporate all minima in spectral curves
#> id B3 H1 FWHM HWHM.l HWHM.r incl.min
#> 1 Acrecca-09 7.2747 307 NA NA 53 Yes
# Use wavelength bounds to narrow in on peak of interest
peakshape(teal, select = 10, lim = c(400, 550))
#> Warning: Consider fixing “lim” in spectra with “incl.min” marked “No” to incorporate all minima in spectral curves
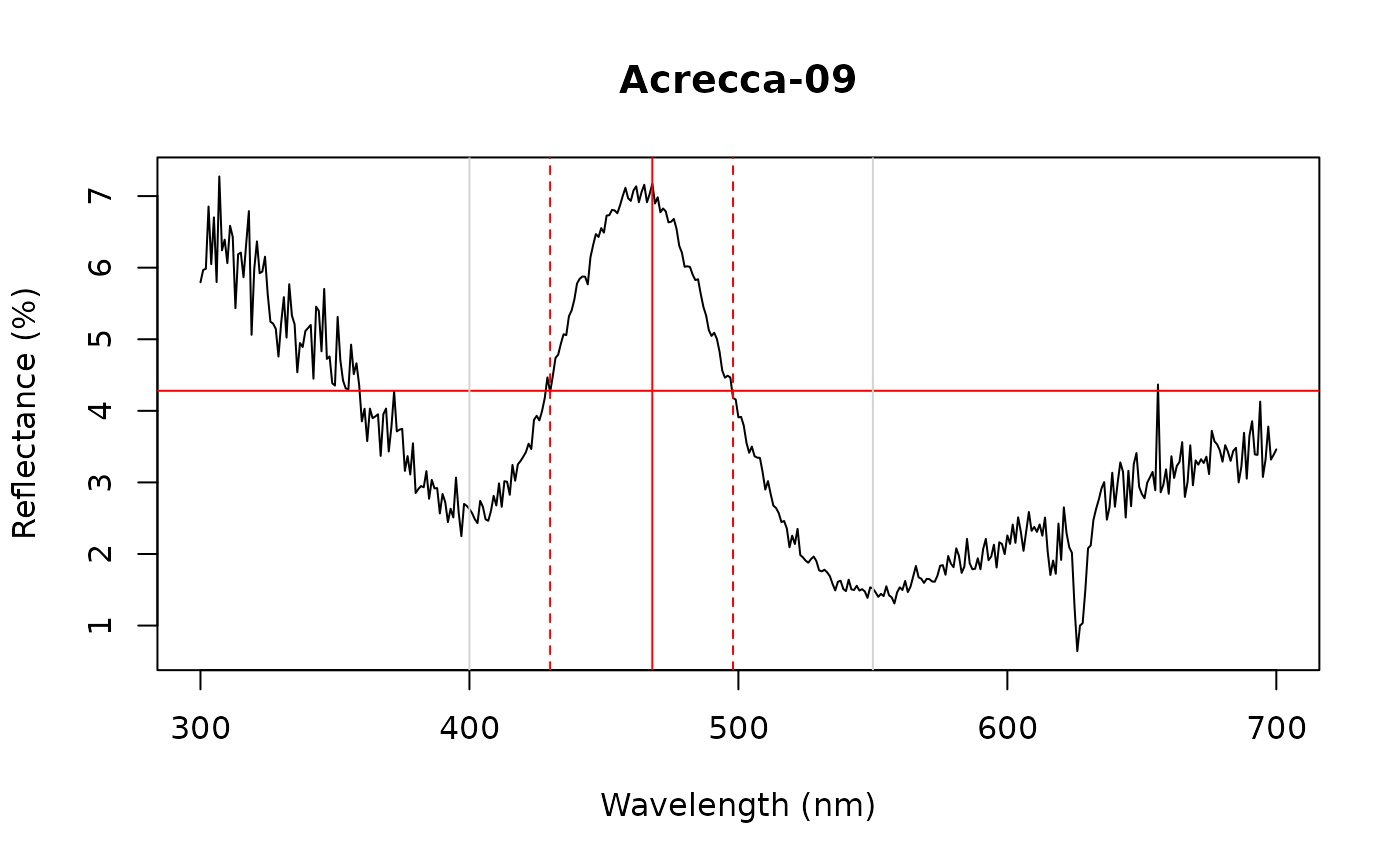 #> id B3 H1 FWHM HWHM.l HWHM.r incl.min
#> 1 Acrecca-09 7.173 468 68 38 30 No
#> id B3 H1 FWHM HWHM.l HWHM.r incl.min
#> 1 Acrecca-09 7.173 468 68 38 30 No