Produces a 2D projection plot of points in a tetrahedral colour space
Adds points to a tetrahedral colorspace projection
Arguments
- tcsdata
(required) tetrahedral color space coordinates, possibly a result from
colspace(), containing values for the 'h.theta' and 'h.phi' coordinates as columns (labeled as such).- ...
additional parameters to be passed to the plotting of data points.
Value
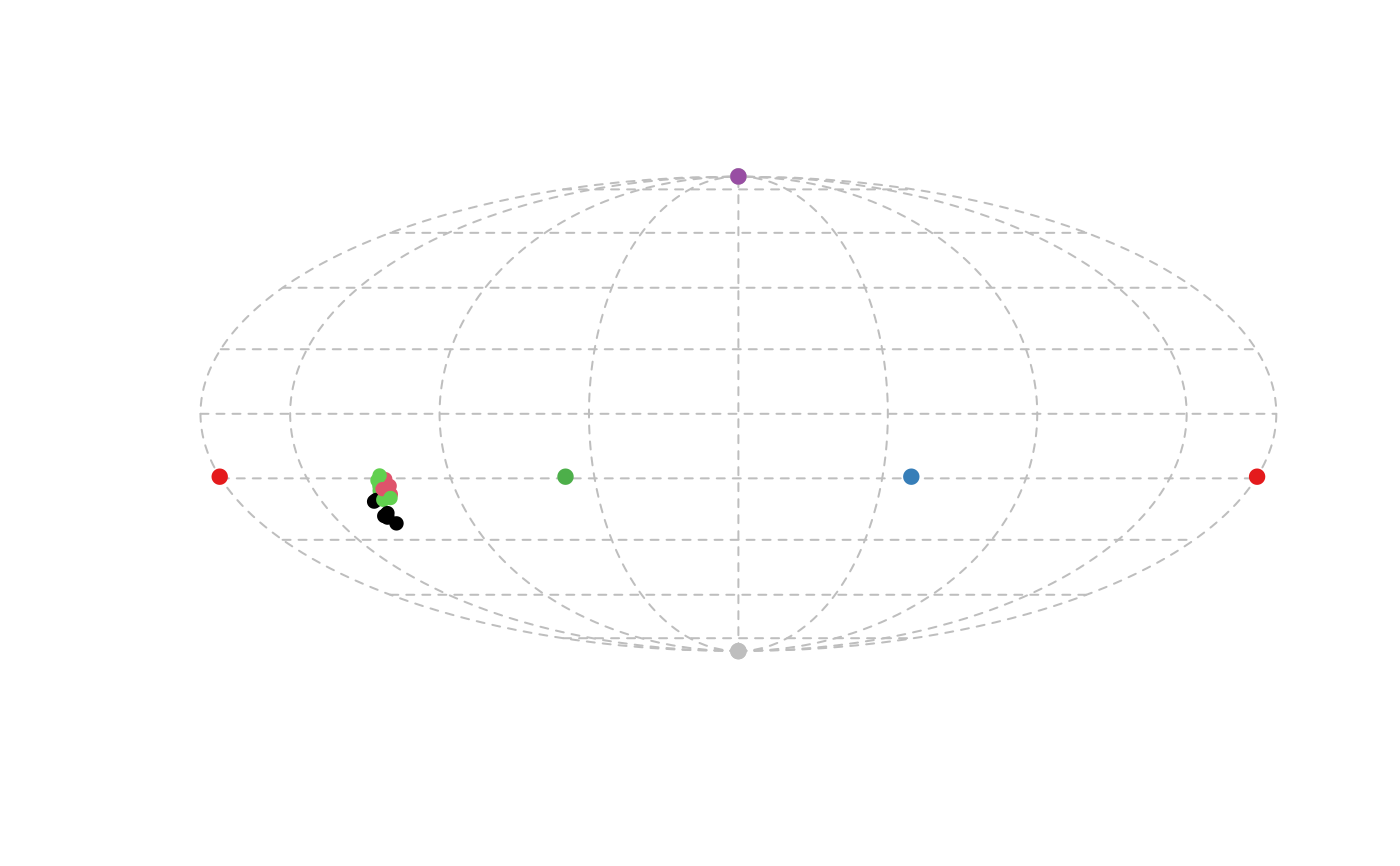
projplot() creates a 2D plot of color points projected from the tetrahedron
to its encapsulating sphere, and is ideal to visualize differences in hue.
projpoints() creates points in a projection color space plot
produced by projplot().
Note
projplot() uses the Mollweide projection, and not the Robinson projection, which
has been used in the past. Among other advantages, the Mollweide projection preserves area
relationships within latitudes without distortion.
References
Stoddard, M. C., & Prum, R. O. (2008). Evolution of avian plumage color in a tetrahedral color space: A phylogenetic analysis of new world buntings. The American Naturalist, 171(6), 755-776.
Endler, J. A., & Mielke, P. (2005). Comparing entire colour patterns as birds see them. Biological Journal Of The Linnean Society, 86(4), 405-431.
Author
Rafael Maia rm72@zips.uakron.edu