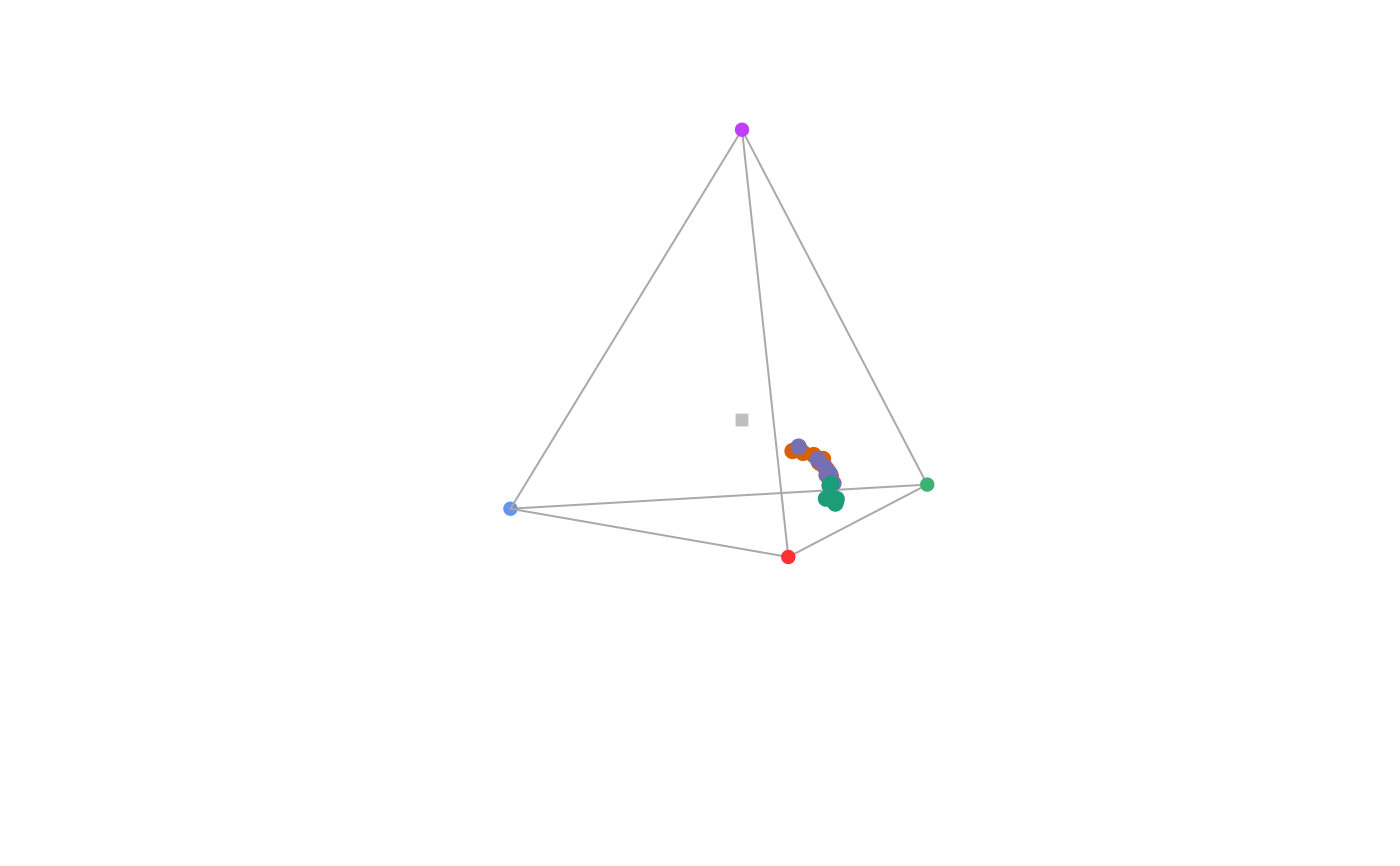
Adds a legend to a static tetrahedral colourspace plot.
Arguments
- x, y
position of the legend relative to plot limits (usually a value between 0 and 1, but because of the perspective distortion, values greater than 1 are possible)
- ...
additional arguments passed to
legend().
Value
legendtetra() adds a legend to a static tetrahedral colourspace plot.
for additional information on which arguments are necessary and how they are used,
see legend().
Author
Rafael Maia rm72@zips.uakron.edu