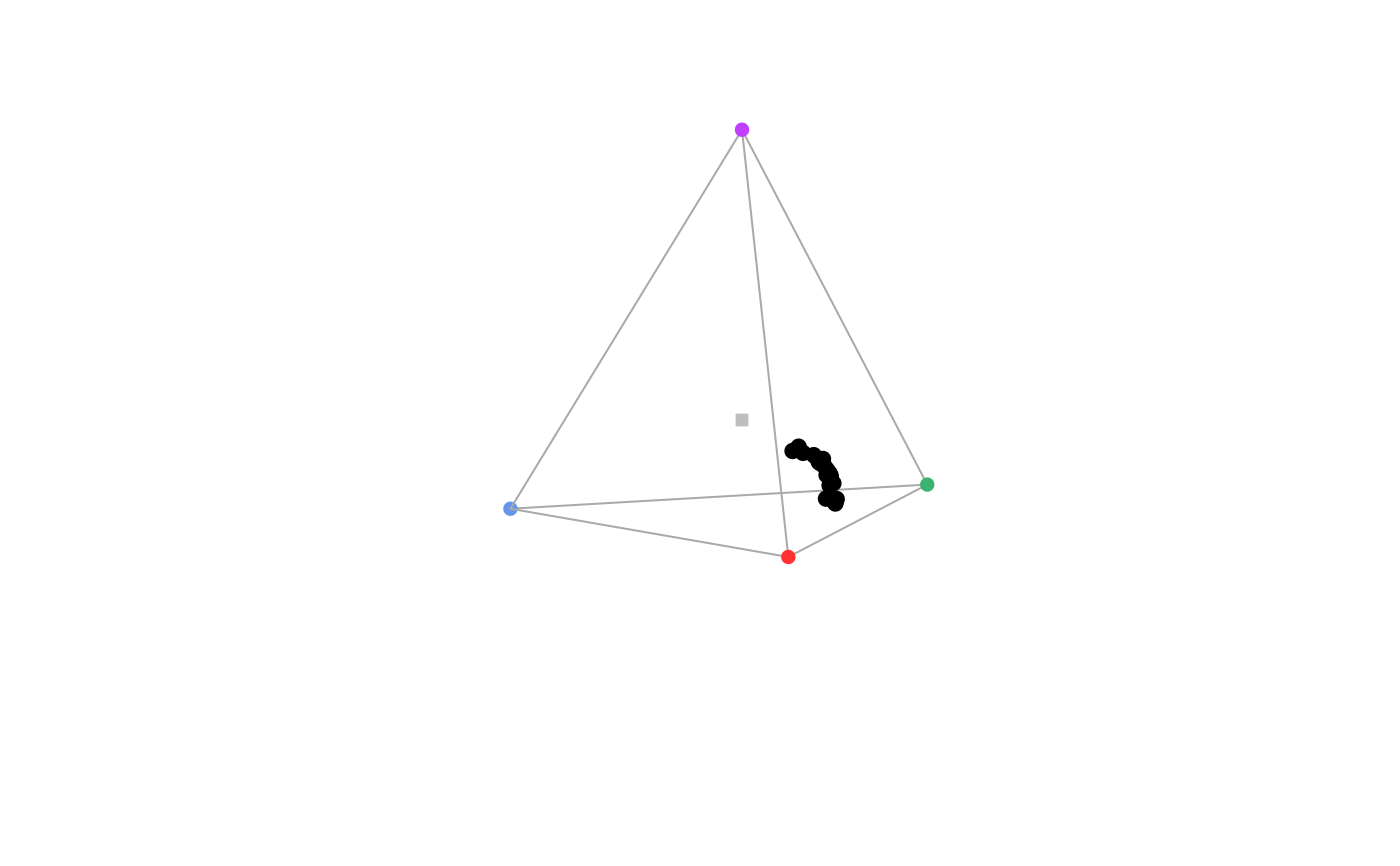
Produces a static 3D tetrahedral plot.
Usage
tetraplot(
  tcsdata,
  theta = 45,
  phi = 10,
  perspective = FALSE,
  range = c(1, 2),
  r = 1e+06,
  zoom = 1,
  achro = TRUE,
  achro.col = "grey",
  achro.size = 1,
  achro.line = FALSE,
  achro.lwd = 1,
  achro.lty = 3,
  tetrahedron = TRUE,
  vert.cex = 1,
  vert.range = c(1, 2),
  out.lwd = 1,
  out.lcol = "darkgrey",
  type = "p",
  labels = FALSE,
  gamut = FALSE,
  ...
)
Arguments
- tcsdata
(required) a data frame, possibly a result from the
colspace()ortcspace()function, containing values for the 'x', 'y' and 'z' coordinates as columns (labeled as such).- theta
angle to rotate the plot in the xy plane (defaults to 45).
- phi
angle to rotate the plot in the yz plane (defaults to 10).
- perspective
logical, should perspective be forced by using point size to reflect distance from the plane of view? (defaults to `FALSE“)
- range,
vert.range multiplier applied to
cexandvert.cex, respectively, to indicate the size range variation reflecting the distance from the plane of view.- r
the distance of the eyepoint from the center of the plotting box. Very high values approximate an orthographic projection (defaults to 1e6). See
persp()for details.- zoom
zooms in (values greater than 1) or out (values between 0 and 1) from the plotting area.
- achro
should a point be plotted at the origin (defaults to
TRUE)?- achro.line
logical. Should the achromatic line be plotted? (defaults to
FALSE)- achro.lwd, achro.lty
graphical parameters for the achromatic coordinates.
- tetrahedron
logical. Should the tetrahedron be plotted? (defaults to
TRUE)- vert.cex
size of the points at the vertices (defaults to 1).
- out.lwd, out.lcol
graphical parameters for the tetrahedral outline.
- type
accepts a vector of length 1 or 2 with 'p' for points and/or 'l' for lines from the point to the base of the tetrahedron.
- labels
logical. Should the name of each cone be printed next to the corresponding vertex?
- gamut
logical. Should the polygon showing the possible colours given visual system and illuminant used in the analysis (defaults to
FALSE). This option currently only works whenqcatch = Qi.- ...
additional graphical options. See
par().
References
Stoddard, M. C., & Prum, R. O. (2008). Evolution of avian plumage color in a tetrahedral color space: A phylogenetic analysis of new world buntings. The American Naturalist, 171(6), 755-776.
Endler, J. A., & Mielke, P. (2005). Comparing entire colour patterns as birds see them. Biological Journal Of The Linnean Society, 86(4), 405-431.
Author
Rafael Maia rm72@zips.uakron.edu
Thomas White thomas.white026@gmail.com
Chad Eliason cme16@zips.uakron.edu