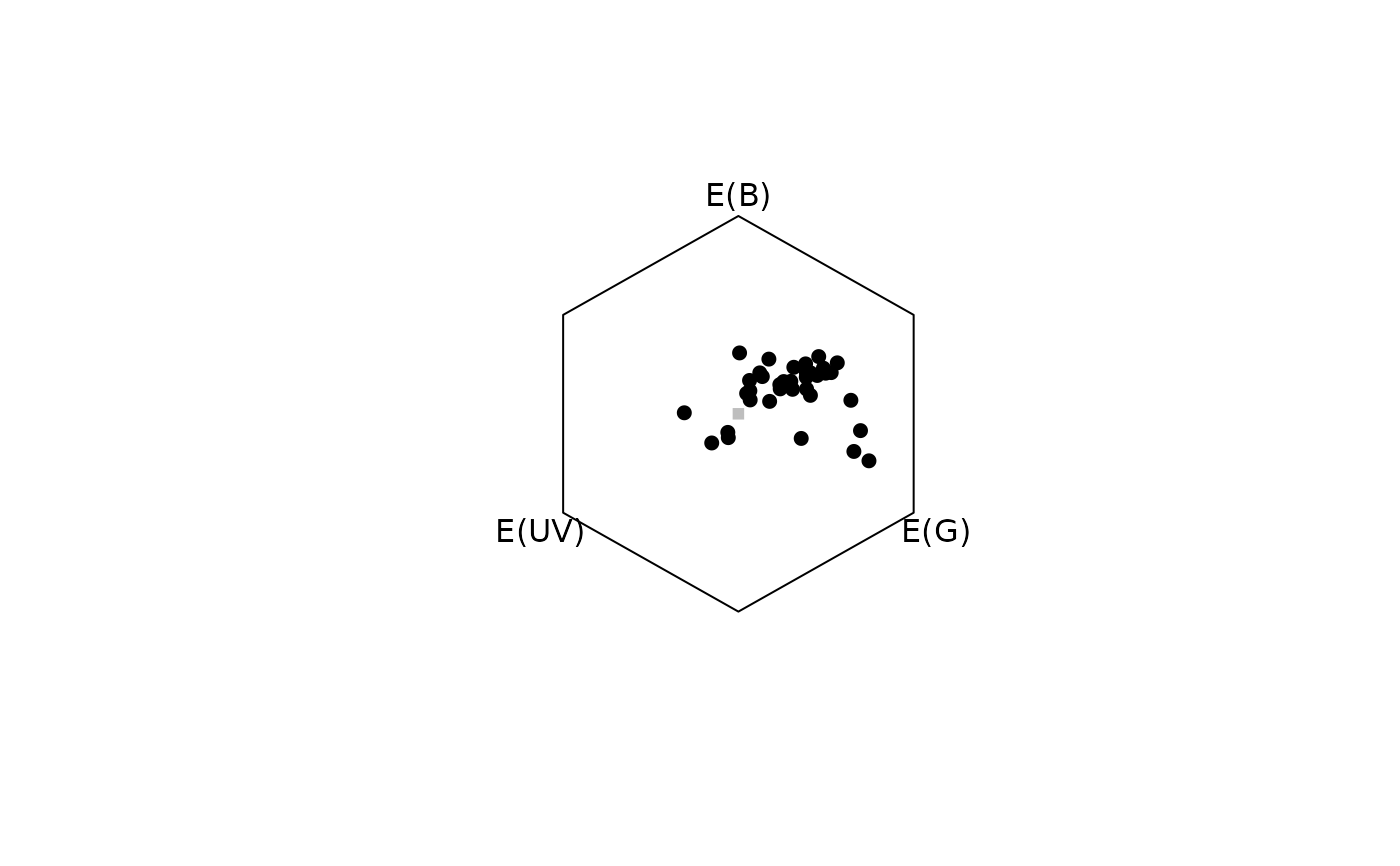
Produces a colour hexagon plot.
Usage
hexplot(
  hexdata,
  achro = TRUE,
  labels = TRUE,
  sectors = c("none", "fine", "coarse"),
  sec.col = "grey",
  out.lwd = 1,
  out.lty = 1,
  out.lcol = "black",
  labels.cex = 1,
  achrosize = 0.8,
  achrocol = "grey",
  square = TRUE,
  ...
)
Arguments
- hexdata
(required) a data frame, possibly a result from the
colspace()orhexagon()function, containing values for the 'x' and 'y' coordinates as columns (labeled as such)- achro
should a point be plotted at the origin (defaults to
TRUE)?- labels
logical. Should the name of each cone be printed next to the corresponding vertex?
- sectors
plot the bee-hue sector dividers? Options are:
"none": No sectors (default)"fine": 36 10-degree sectors"coarse": six bee-hue sectors (blue, blue-green, green, uv-green, uv, uv-blue).
- sec.col
line colour of hue sector dividers. Defaults to
"grey".- out.lwd, out.lcol, out.lty
graphical parameters for the plot outline.
- labels.cex
size of the arrow labels.
- achrosize
size of the point at the origin when
achro = TRUE(defaults to0.8).- achrocol
color of the point at the origin
achro = TRUE(defaults to'grey').- square
logical. Should the aspect ratio of the plot be held to 1:1? (defaults to
TRUE).- ...
additional graphical options. See
par().
References
Chittka L. (1992). The colour hexagon: a chromaticity diagram based on photoreceptor excitations as a generalized representation of colour opponency. Journal of Comparative Physiology A, 170(5), 533-543.
Chittka L, Shmida A, Troje N, Menzel R. (1994). Ultraviolet as a component of flower reflections, and the colour perception of Hymenoptera. Vision research, 34(11), 1489-1508.
Author
Thomas White thomas.white026@gmail.com