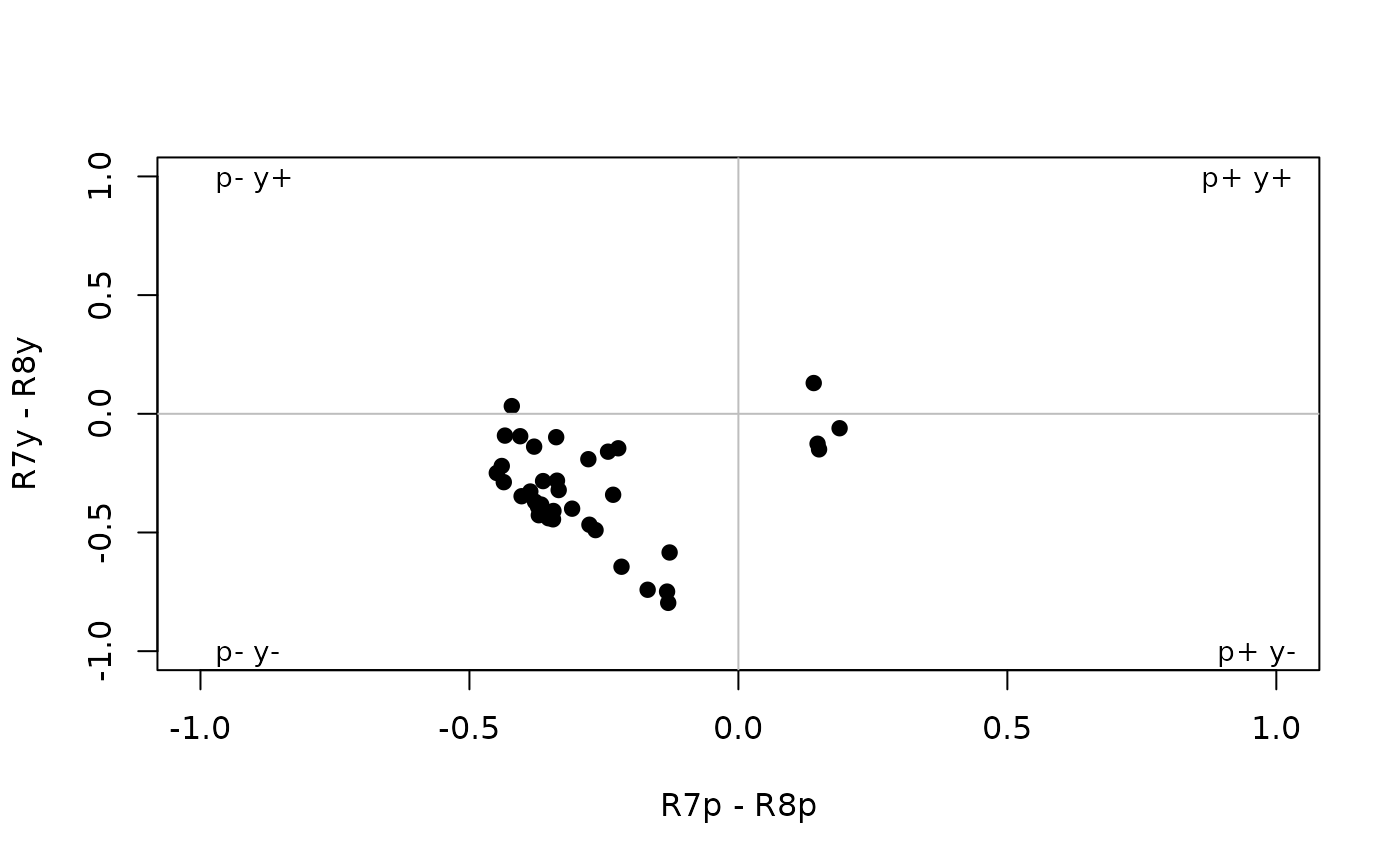
Produces a plot based on Troje's (1993) categorical colour model.
Arguments
- catdata
(required) a data frame, possibly a result from the
colspace()orcategorical()function, containing values for 'x' and 'y' coordinates as columns (labeled as such).- labels
plot category labels inside? Defaults to
TRUE.- labels.cex
size of the arrow labels.
- ...
additional graphical options. See
par().
References
Troje N. (1993). Spectral categories in the learning behaviour of blowflies. Zeitschrift fur Naturforschung C, 48, 96-96.
Author
Thomas White thomas.white026@gmail.com