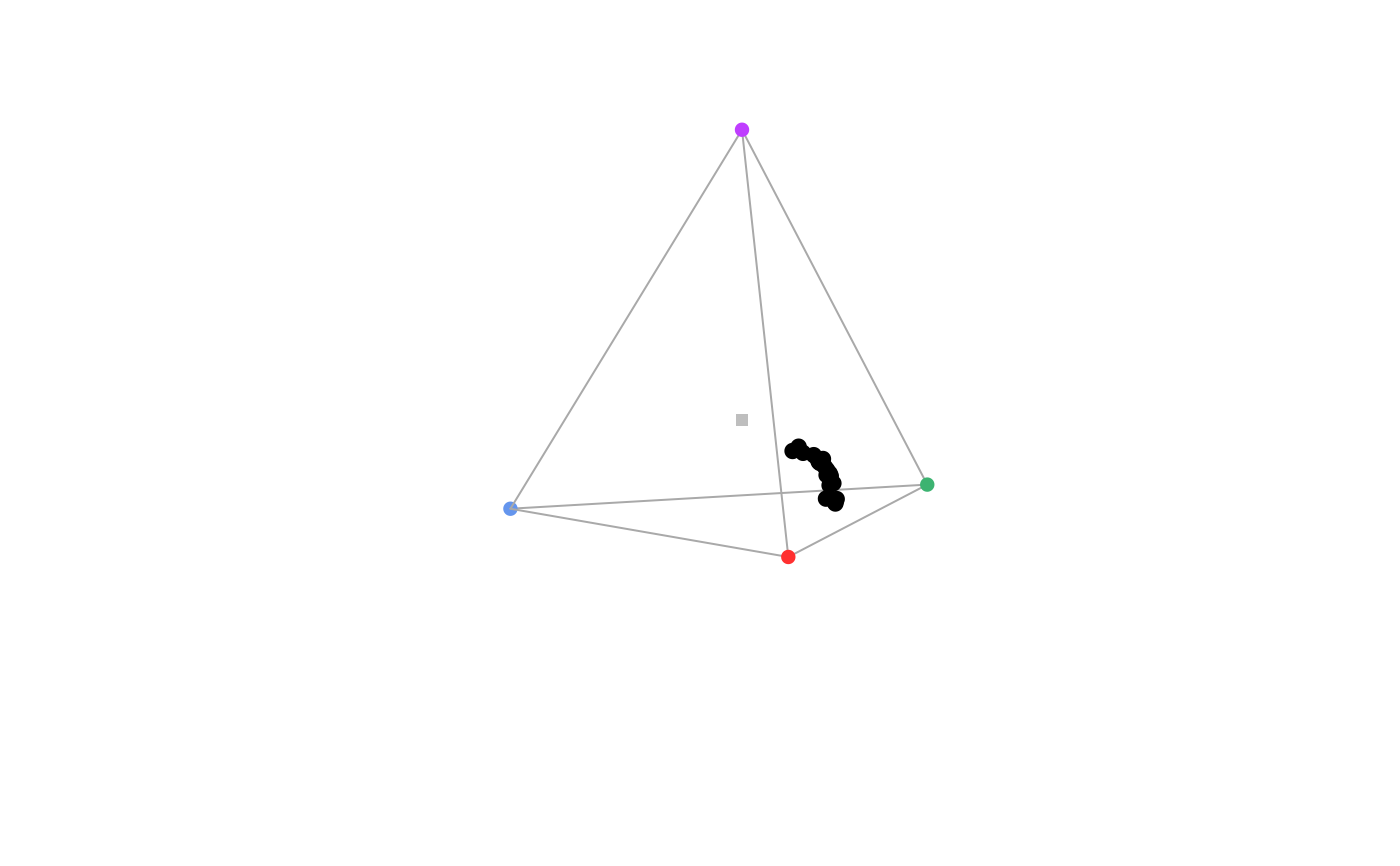
Plots reference x, y and z arrows showing the direction of the axes in a static tetrahedral colourspace plot.
Arguments
- x, y
position of the legend relative to plot limits (usually a value between 0 and 1, but because of the perspective distortion, values greater than 1 are possible)
- size
length of the arrows. Can be either a single value (applied for x, y and z) or a vector of 3 separate values for each axis.
- arrowhead
size of the arrowhead.
- col, lty, lwd
graphical parameters for the arrows.
- label
logical, include x, y and z labels (defaults to
TRUE).- adj.label
position adjustment for the labels. a list of 3 named objects for x, y and z arrows, each with 2 values for x and y adjustment.
- label.cex, label.col
graphical parameters for the labels.
Value
axistetra adds reference arrows showing the direction of the
3-dimensional axes in a static tetrahedral colourspace plot.
Author
Rafael Maia rm72@zips.uakron.edu