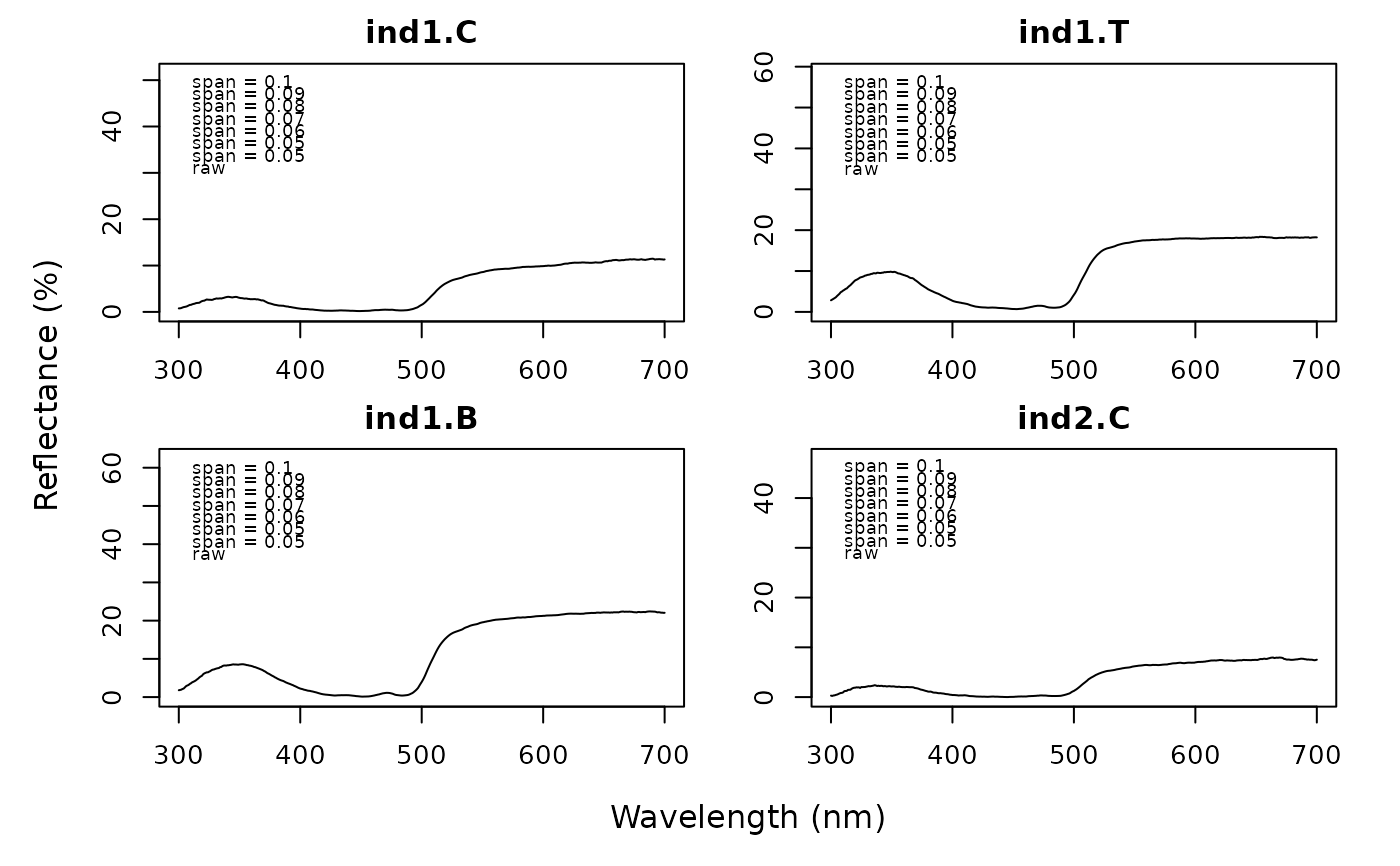
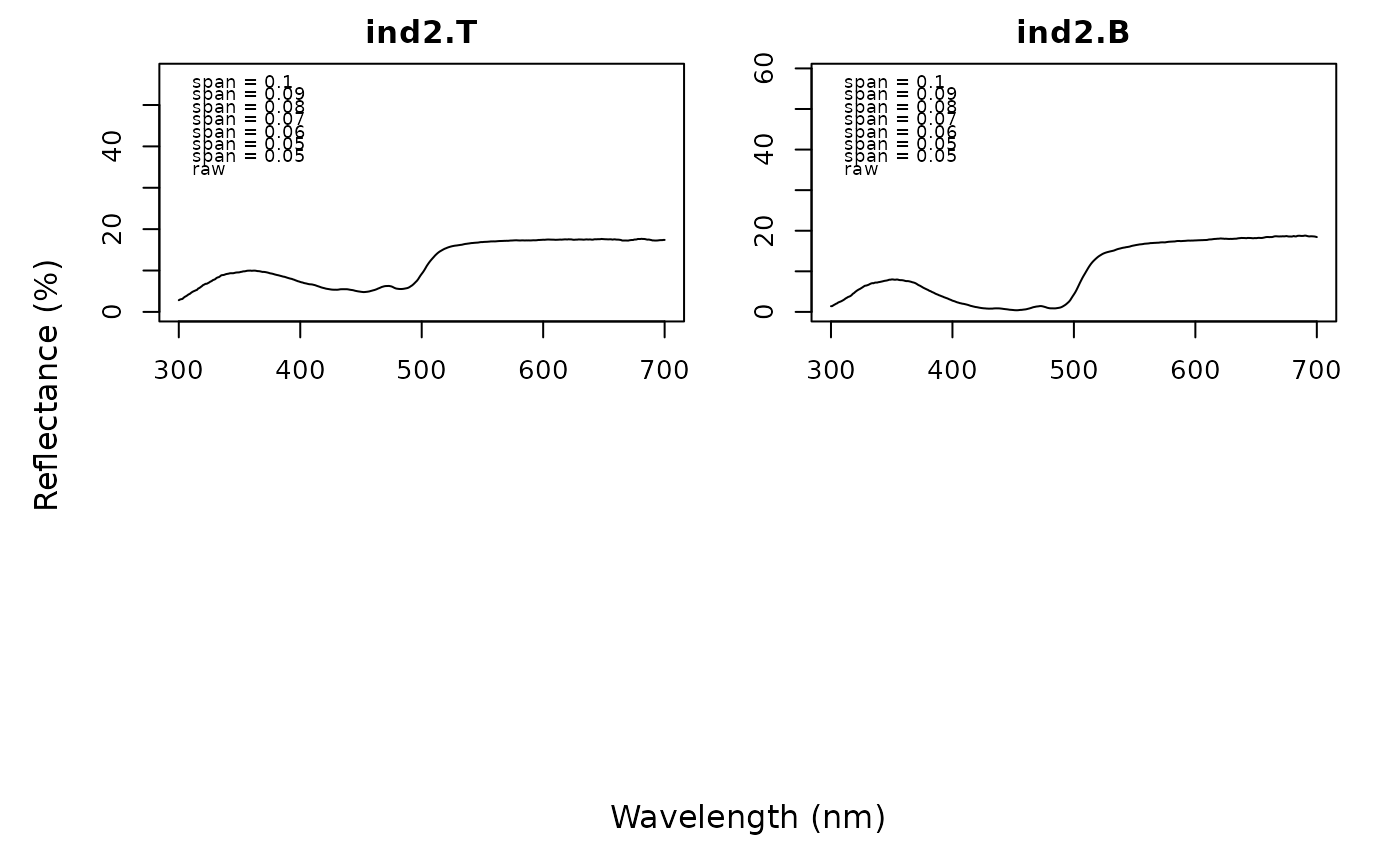
Plots spectral curves with various levels of loess smoothing to help decide which
loess parameters are best for subsequently smoothing the data (e.g. via procspec()).
Usage
plotsmooth(
  rspecdata,
  minsmooth = 0.05,
  maxsmooth = 0.2,
  curves = 5,
  specnum = "ALL",
  ask = TRUE
)
Arguments
- rspecdata
(required) a data frame, possibly of class
rspec, which contains a column containing a wavelength range, named 'wl', and spectra data in remaining columns.- minsmooth
the minimum f value of the loess function to visualize (defaults to
0.05).- maxsmooth
the maximum f value of the loess function to visualize (defaults to
0.20).- curves
the number of curves to display on the same plot (defaults to
5).- specnum
the number of spectral curves, from the data frame, to visualize (defaults to
ALL).- ask
logical. if
TRUE, asks for user input before changing plot pages
Author
Pierre-Paul Bitton bittonp@uwindsor.ca
Examples
# Load reflectance spectra
data(sicalis)

# Visualise the spectral reflectance curves across a range of smoothing levels
plotsmooth(sicalis, minsmooth = 0.05, maxsmooth = 0.1, curves = 7, specnum = 6)