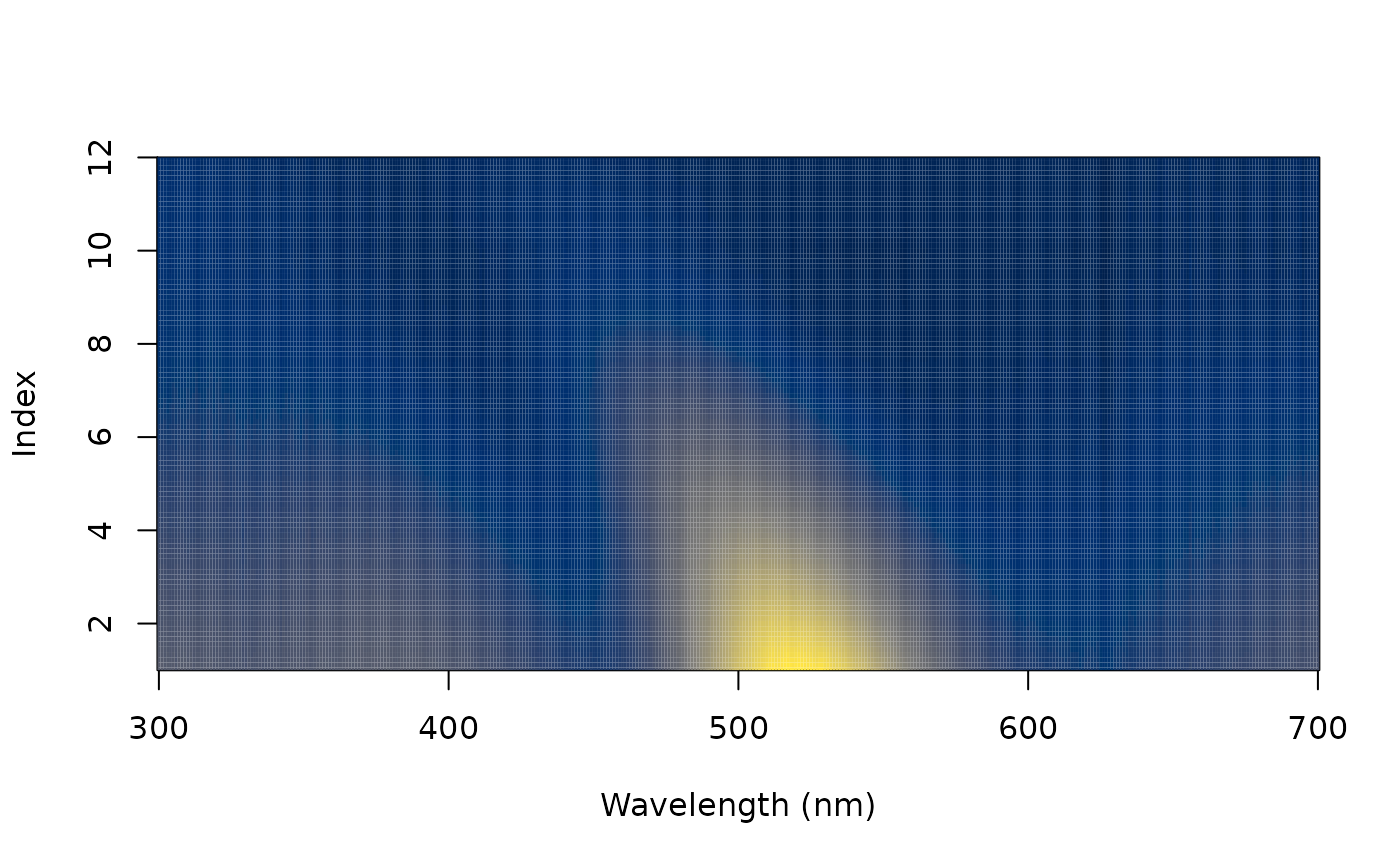
Plots reflectance spectra in different arrangements.
Arguments
- x
(required) a data frame, possibly an object of class
rspec, with a column with wavelength data, named 'wl', and the remaining column containing spectra to plot.- select
specification of which spectra to plot. Can be a numeric vector or factor (e.g.,
sex == "male")- type
what type of plot should be drawn. Possibilities are:
overlay(default) for plotting multiple spectra in a single panel with a common y-axis.stackfor plotting multiple spectra in a vertical arrangement.heatmapfor plotting reflectance values by wavelength and a third variable (varying).
- varying
a numeric vector giving values for y-axis in
type = "heatmap".- n
number of bins with which to interpolate colors and
varyingfor the heatplot.- labels
logical. Add labels identifying each spectrum to the outer plot margin? Defaults to
FALSE. Ignored whentype = 'heatmap'.- labels.stack
a vector of labels for spectra when
labels = TRUE. Defaults to the column names from spectral data. Note you will likely want to adjust the plot margins to accommodate the text labels. See?par()for guidance on setting margins.- labels.cex
size of the text labels when
labels = TRUE.- wl.guide
logical determining whether visible light spectrum should be added to the x-axis.
- ...
additional arguments passed to
plot()(orimage()for"heatmap").
Author
Thomas White thomas.white026@gmail.com
Hugo Gruson hugo.gruson+R@normalesup.org
Chad Eliason cme16@zips.uakron.edu


