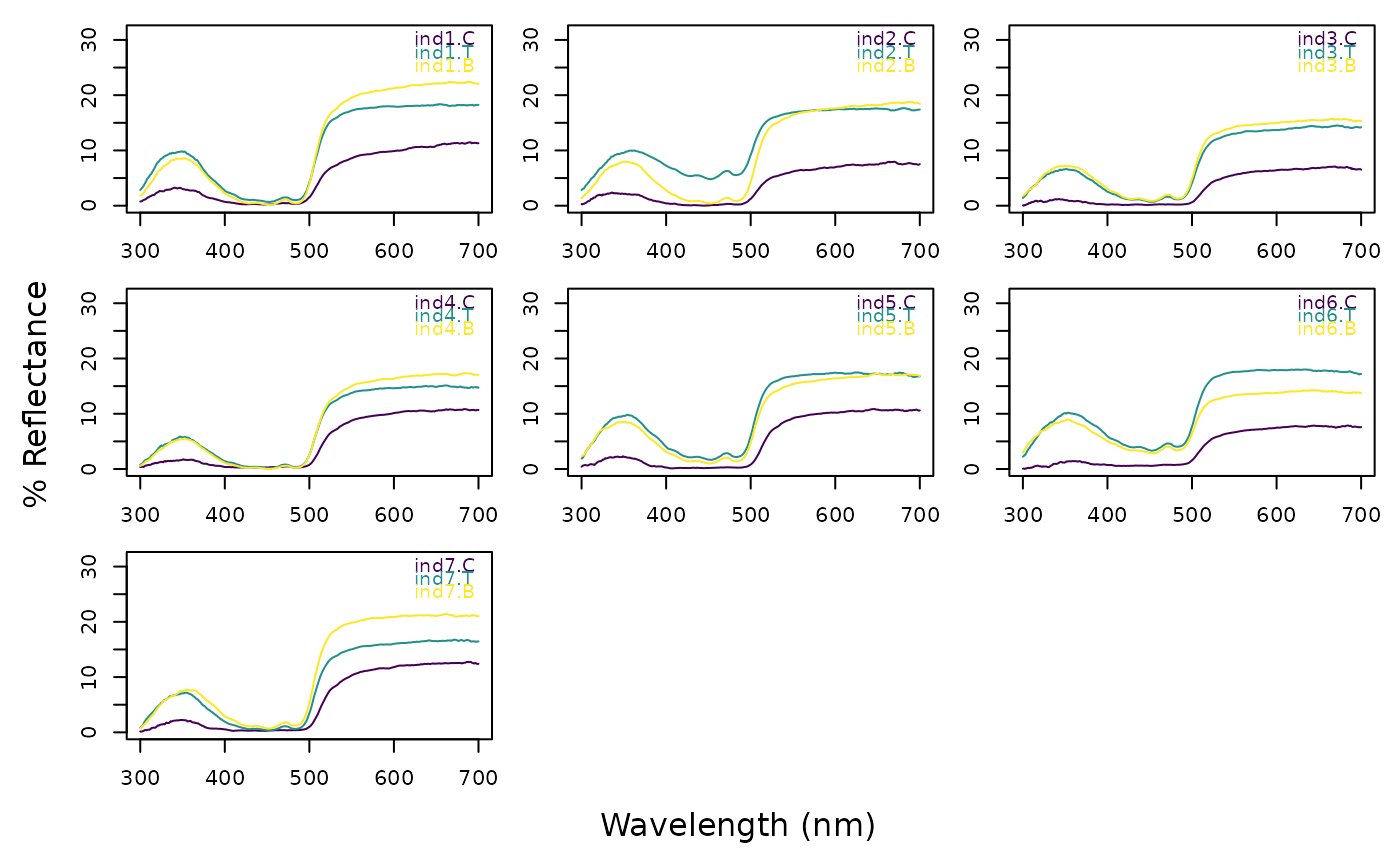
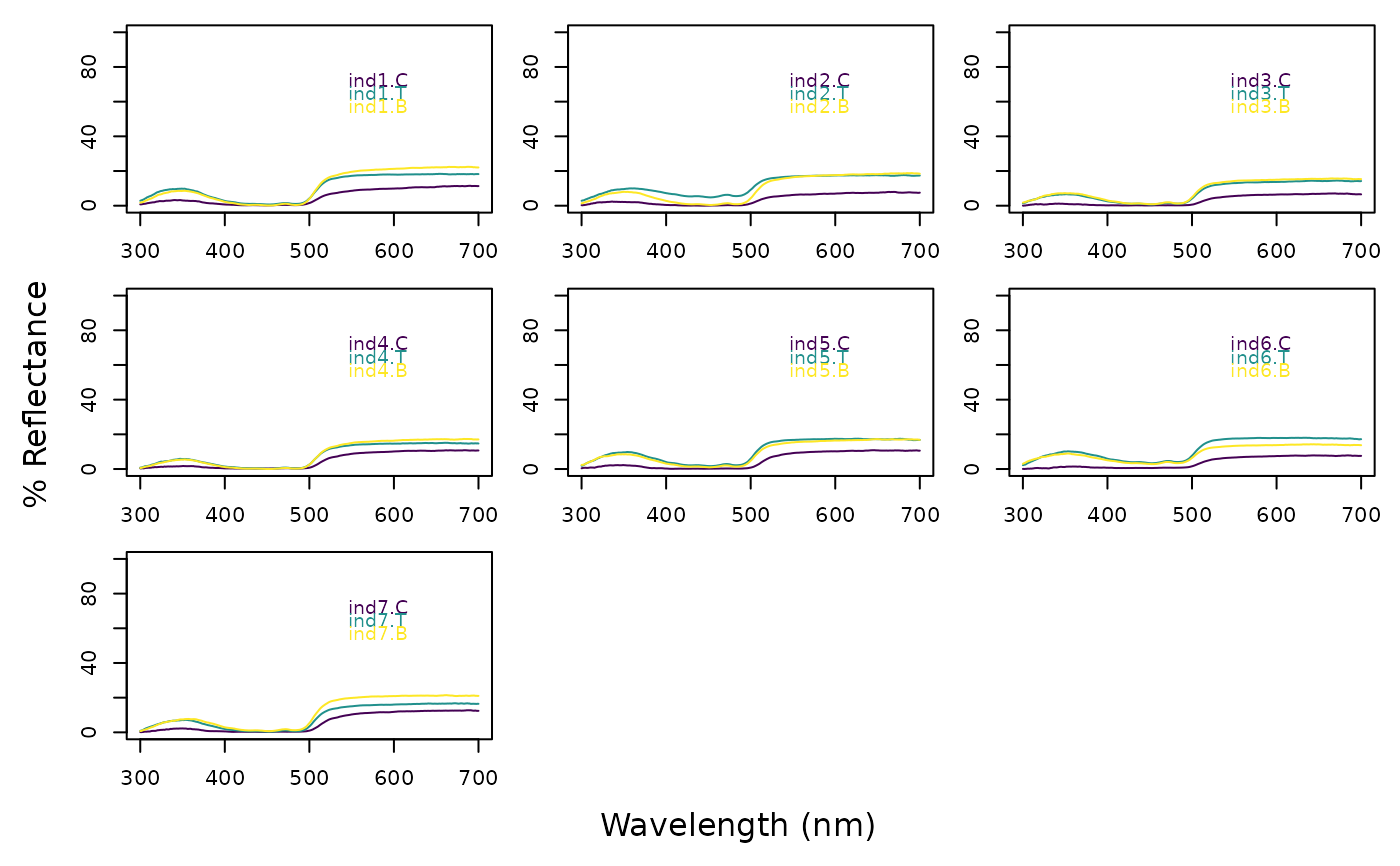
Plots one or multiple spectral curves in the same graph to rapidly compare groups of spectra.
Usage
explorespec(
  rspecdata,
  by = 1,
  scale = c("equal", "free"),
  legpos = "topright",
  ...
)
Arguments
- rspecdata
(required) a data frame, possibly of class
rspec, which contains a column containing a wavelength range, named 'wl', and spectra data in remaining columns.- by
number of spectra to include in each graph (defaults to 1)
- scale
defines how the y-axis should be scaled.
"free": panels can vary in the range of the y-axis;"equal": all panels have the y-axis with the same range.- legpos
legend position control. Either a vector containing
xandycoordinates or a single keyword from the list:"bottomright","bottom","bottomleft","left","topleft","top","topright","right"and"center".- ...
additional parameters to be passed to plot
Author
Pierre-Paul Bitton bittonp@uwindsor.ca