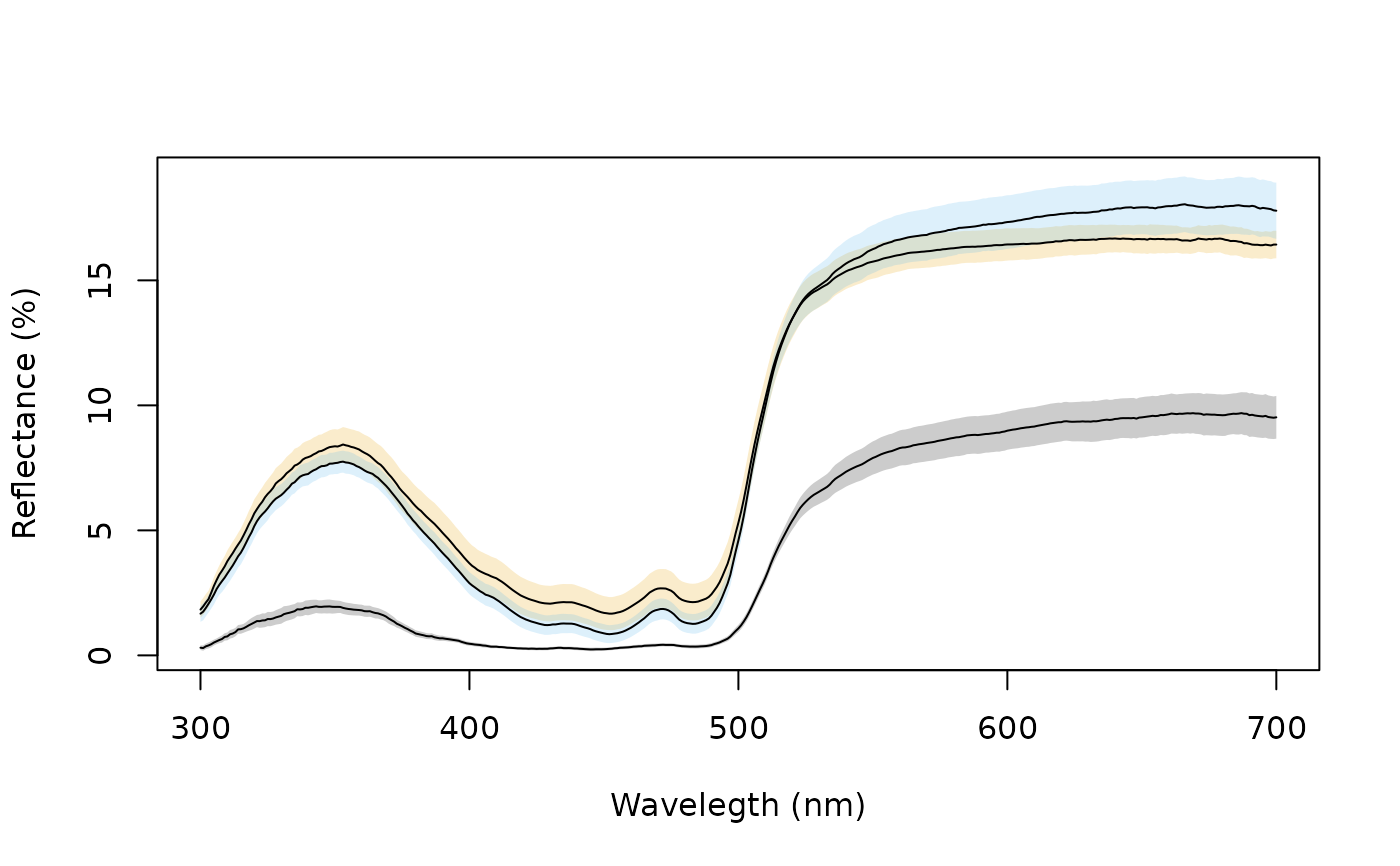
Combines and plots spectra (by taking the average and the standard deviation, for example) according to an index or a vector of identities.
Usage
aggplot(
  rspecdata,
  by = NULL,
  FUN.center = mean,
  FUN.error = sd,
  lcol = NULL,
  shadecol = NULL,
  alpha = 0.2,
  legend = FALSE,
  ...
)
Arguments
- rspecdata
(required) a data frame, possibly of class
rspec, which contains a column containing a wavelength range, named 'wl', and spectra data in remaining columns.- by
(required) either a single value specifying the range of spectra within the data frame to be combined (for example,
by= 3 indicates the function will be applied to groups of 3 consecutive columns in the spectra data frame); a vector containing identifications for the columns in the spectra data frame (in which case the function will be applied to each group of spectra sharing the same identification); or a list of vectors, e.g.,by = list(sex, species).- FUN.center
the function to be applied to the groups of spectra, calculating a measure of central tendency (defaults to
base::mean()).- FUN.error
the function to be applied to the groups of spectra, calculating a measure of variation (defaults to
stats::sd()).- lcol
colour of plotted lines indicating central tendency.
- shadecol
colour of shaded areas indicating variance measure.
- alpha
transparency of the shaded areas.
- legend
automatically add a legend.
- ...
additional graphical parameters to be passed to plot.
References
Montgomerie R (2006) Analyzing colors. In: Hill G, McGraw K (eds) Bird coloration. Harvard University Press, Cambridge, pp 90-147.
Examples
# Load reflectance data
data(sicalis)

# Create grouping variable based on spec names
bysic <- gsub("^ind[0-9].", "", names(sicalis)[-1])

# Plot using various error functions and options
aggplot(sicalis, bysic)

aggplot(sicalis, bysic, FUN.error = function(x) quantile(x, c(0.0275, 0.975)))

aggplot(sicalis, bysic, shadecol = spec2rgb(sicalis), lcol = 1)

aggplot(sicalis, bysic, lcol = 1, FUN.error = function(x) sd(x) / sqrt(length(x)))